Gantt Charts, Resources, and Earned Value
Gantt Charts
Section titled “Gantt Charts”A Gantt chart is a time-scaled horizontal bar chart in which each activity is shown against its planned start, finish, and often its actual progress.
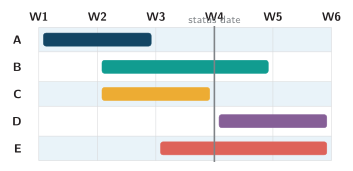
Illustrative Gantt chart for five activities over six weeks
| Advantages | Limitations |
|---|---|
| Easy for stakeholders to read | Dense projects can become visually complex |
| Communicates planned dates and overlap | Dependencies may be hidden unless explicit links are added |
| Supports progress and milestone tracking | A basic chart does not calculate the critical path |
| Useful for coordination and reporting | Resource conflicts are not automatically resolved |
| Can show baseline versus actual position | Frequent change requires disciplined updating and version control |
Strengths and limitations of a Gantt chart
| Feature | Gantt chart | CPM/PERT network |
|---|---|---|
| Visual basis | Time-scaled bars | Nodes and precedence arrows |
| Dependencies | Optional or less prominent | Explicit and central |
| Critical path | May be highlighted after calculation | Derived from the network |
| Best use | Communication and time tracking | Logical and quantitative analysis |
Gantt and network views are complementary
Scheduling and Resource Adjustment
Section titled “Scheduling and Resource Adjustment”Project scheduling requires activity identification, duration estimation, precedence logic, resource assignment, calendar constraints, milestone setting, and a time-scaled baseline. A mathematically feasible network may still be impossible if two simultaneous activities demand the same unavailable resource.
Resource leveling adjusts activity timing to remove resource over-allocation. It can move activities beyond available float and therefore may extend the critical path and project completion date.
Resource smoothing shifts activities only within existing float so that a fixed project completion date is preserved. It improves the resource profile but may not remove every overload.
| Method | Action | Likely effect |
|---|---|---|
| Delay non-critical work | Move an activity into unused float | Completion may remain unchanged |
| Activity splitting | Interrupt and resume work where technically feasible | More coordination and setup cost |
| Resource smoothing | Shift only within float | Deadline unchanged; overload may remain |
| Resource leveling | Reschedule according to constrained resource availability | Deadline may move |
| Add or substitute resources | Increase capacity, overtime, subcontract, or alter method | Higher cost or quality/risk implications |
Methods for resolving resource conflicts
If activities B and C both require one crane in week 3, first compare their float and priority. Move the activity with usable float; if both are critical, add capacity, change sequence or method, or accept a later finish through formal change control.
Earned Value Management
Section titled “Earned Value Management”Earned Value Management (EVM) integrates scope, schedule, and cost by expressing planned work, completed work, and actual expenditure in the same monetary units at a defined status date.
| Measure | Formula | Interpretation |
|---|---|---|
| Planned value (PV) | Budgeted cost of scheduled work | Budgeted value of work planned by the status date |
| Earned value (EV) | Budgeted cost of work performed | Budgeted value of work actually completed |
| Actual cost (AC) | Actual cost of work performed | Cost actually incurred for completed work |
| Cost variance (CV) | Negative means over budget | |
| Schedule variance (SV) | Negative means less work than planned | |
| Cost performance index (CPI) | Below 1 means cost inefficiency | |
| Schedule performance index (SPI) | Below 1 means behind the planned work rate |
Core earned-value quantities and indicators